
50 lines of code behind one line of reporting
Sept. 18, 2018
Pierre loves math. He moved from his home in Haiti's countryside to Port-au-Prince so he can study it. And here he lives in a single room he shares with his family, paying his way, little by little, through school. That chalkboard behind him is how he does homework. I met dozens of people like him who came to the city in search of education. I met government officials who said pursuit of education was one of the main reasons this already overcrowded city swells with 800 new arrivals each day. And I have read the websites of educational charities that lament the steep inequality of access to education between urban and rural areas.
So anecdotally it was pretty clear education is unequal in Haiti. But I didn't have any hard facts to back it up. I really wanted something concrete, so I could avoid the typically handwavey journalese ("the vast majority," "a growing number," "most experts say.") This is the story of how I found those facts, using internet research and a few programming techniques.
The search
The most obvious route to the facts would be to call someone up, preferably in the government. Unfortunately, my French is bad and my Creole worse. Trying to find the right person and explain what I wanted would have taken me longer than I had available for the story.
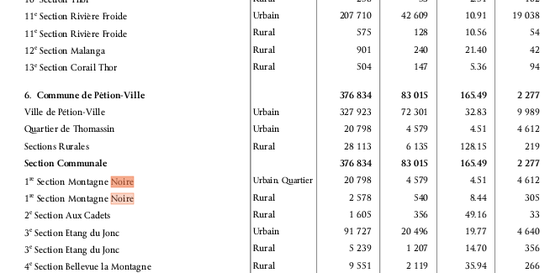
The next most obvious source of information is the internet. The Haitian government does not have much of an internet presence and so I began with brute force DuckDuckGo searches. But these only turned up page after page of charity web sites full of marketing bumph. Finally I headed with a sigh to the Haitian Ministry of Education page... and was pleasantly surprised. There I found a 2015 census of secondary schools. It enumerates schools across the country by funding source (public, private, charity, religious etc), building materials, their state of up-keep and how many schools are in rural versus urban areas. Bingo!

Except the numbers don't really show an imbalance: 218 schools in rural areas, versus 210 in urban areas; not far from the roughly 42% rural / 58% urban split for the population as a whole. Had I just managed to disprove my argument?
Well, I had heard that one of the obstacles to education in rural areas was the distance from school to home, with some children having to walk several hours each day to get to school. There are no school buses in Haiti, at least for public schools. So although the schools seem to be equally distributed by population, perhaps they are less so by distance. If I could find out how much area those 218 rural schools have to serve, versus the area served by urban schools, I might still be able to make a numbers-based case for educational inequality.
The Ministry of Education report had nothing to say on the matter. Fortunately, the Haitian Institute of Statistics (IHSI) website has a document that lists every Communal Section (a political subdivision, like a municipality) along with a classification of whether they are rural or urban.
All I had to do was figure out how many Communal Sections of each kind were on the list, and compare that ratio to the ratio of the number of schools. Easy, right? Sure, if this list had been in the form of a spreadsheet, which you would expect from an institution whose main job is to produce data. Strangely, it was in the form of a pdf, a format designed for reading like a book, for flipping through page by page, not for actually manipulating the data. Time for some converting.
From pdf to text
tools required: a pdf to txt converter
My first step was to convert my original document to a txt file. A .txt file consists entirely of visible characters, numbers and spaces. It has none of the hidden format codes that word processors, spreadsheets and other software insert into content. Txt files are ugly to look at, but extremely easy to manipulate and analyze. There are numerous pdf to txt converters online (and Adobe Acrobat reader can also do it), but I got the best results with Zamzar. I then opened the file in a text editor (not a word processor, which will reinsert format codes that interfere with the process of cleaning data.) to see that the conversion had faithfully recreated the table layout by using spaces between data to line them up in columns.
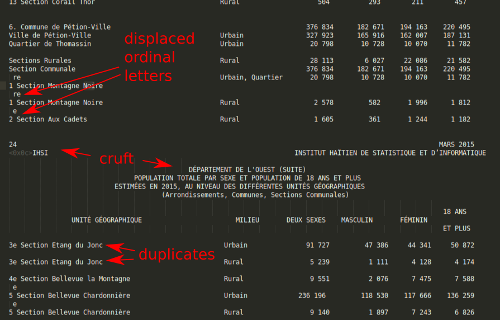
Between each page, however, the converter left a mess of headers, footers, page numbers, and table headings. There were also a few glaring irregularities in the table rows. Most notably, the little "e"s and "re"s on the end of French ordinal numbers got placed onto their own rows. I could fix those problems manually, by copy and pasting them one by one...
Cleaning the table
tools required: a text editor with a regular expression search
...or I could do it in a few seconds with regular expressions. Regular expressions are a technique for finding bits of text within larger bits of text. It's like your standard search-and-replace amped to 11. To search and replace with regular expressions, you combine text with symbols and codes that match patterns and logical rules, such as "it is the same as that", "if it matches this but doesn't match that," or "it contains this, but not at the beginning or end of the word and only when it is also next to this other word." Regular expressions look arcane and off-putting to novices, but they are incredibly powerful:
"\w+? fox"
This will match any occurence of "fox" and the word immediately preceding it:
The quick red fox jumped over the lazy fox
This one will match the same, but only where fox is at the end of a line:
"\w+? fox\n"
The quick red fox jumped over the lazy fox
Regular expressions are used by programmers in some pretty sophisticated algorithms. But they are also available within the search-and-replace function of many text editors. Here's some tutorials that can show you how to use them on your documents.
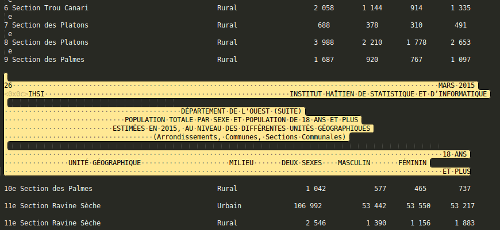
How does all this apply to my document? Although the bits of text left between the pages looked crufty and random, there was a noticeable pattern. Each block began with a page number, and ended with the words "18 ans et plus", the list column header over each table. Thus I created a regular expression that searched for a digit at the beginning of a line and ended with "et plus." (It was a bit more complicated than that, to weed out false positives, but not much).
"\n\{1,3}.+?MARS 2015(.|\n)+?\n +?ET PLUS"
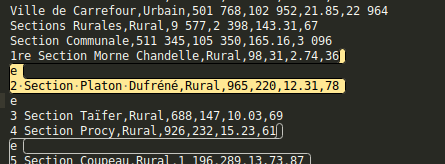
With a couple of clicks I eliminated everything that wasn't useful data in the document. Another regex converted the spaces between each column into commas, leaving me with lines of comma-separated values, easily readable by a spreadsheet.
3 Section Martissant, Urbain, 293041, 62189, 5.62, 52143
2 Commune de Delmas, , 395260, 83557, 27.74, 14249
Ville de Delmas, Urbain, 395260, 83557, 27.74, 14249
Section Communale, , 395260, 83557, 27.74, 14249
1 Section St Martin, Urbain, 395260, 83557, 27.74, 14249
3 Commune de Cité Soleil, , 265072, 59297, 21.81, 12154
Ville de Cité Soleil, Urbain, 265072, 59297, 21.81, 12154
The problem of the misplaced "e"s and "re"s seems more difficult to fix, since it was not a simple matter of erasing text. Regular expressions, however, were up to the job. They can extract subsections of matched text with ( ) brackets in the search, and then recall them later, like so ${1}. This regex discovered misplaced "e"s and returned them to their rightful place beside their ordinal numbers.
find: \ne\n(\d+?)(.+?)\n
replace: ${1}e${2}\n
Deduplication
tools required: python programming language
A much trickier problem was presented by the duplicate lines. It sometimes happened that a Communal Section had both a rural and an urban population and was therefore listed twice. If I counted both I would have an inaccurate total of Sections. What I decided to do was locate duplicate entries, compare their populations and classify the Section according to whichever population was larger. Methodologically, I'm not sure if this is sound, but I was so far into my data that I couldn't abandon it now.
I don't think Regular Expressions can compare values (I may be wrong) so I decided to use the Python for this task. It's the world's most popular programming language according to some. When people think of programming, they often think of sitting down for 8 hours a day and building complicated applications using lots of math and specialized concepts. You can do that with Python, but useful programs can also be just a few lines long and written in minutes. Here are some resources for learning Python:
And here is the program I wrote to eliminate duplicate lines from the document:
#open the file on the hard drive
f = open("density_edit1.txt", "r")

#convert it to a list by splitting it at the
#end of each line
doc = f.read().split('\n')
f.close()

# an empty list that will accumulate the lines from
# doc one by one, after being filtered for duplicates
new_doc = []

# dupes as a holding pen. Matching lines accumulate here until
# a non-matching line turns up. Then one of the dupes is added to
# new_doc, and the non-matching line becomes the new sole occupant
# of dupes
dupes = [("",)]
for line in doc:
	line = line.split(",")

	# there is no data in the line
	if len(line) < 6:
		new_doc.append(",".join(dupes[0]))
		new_doc.append(" ".join(line))
		dupes=[("",)]
		continue
	# we have a match!
	if line[0] == dupes[0][0]:
		dupes.append(line)
	# no match but there are multiple dupes to process
	elif len(dupes)>1:
		print(dupes)
		dupes.sort(key=lambda d: int(d[2]), reverse=True)
		new_doc.append(",".join(dupes[0]))
		dupes = [line]
	# no match and no dupes accumulated
	else:
		new_doc.append(",".join(dupes[0]))
		dupes = [line]

f=open("population_dedupe_edit2.csv", "w")
f.write("\n".join(new_doc))
It might look like gibberish but it is actually quite simple. It opens the text file and breaks it into a list of rows of data, corresponding to the rows in a spreadsheet. It then runs repeatedly, looking at one row on each repetition and breaking it into further elements, corresponding to the cells in a row. It then stored these elements in a variable called "line.". The first item in this line contains the name of the Communal Section, the second, the classification of "urban" or "rural", the third, the population etc. Here's how to get the contents of one such line.
print(line[351])
['1 Section St Martin','Urbain','395260','83557','27.74','14249']
And here's the population it stores.
print(line[351][2])
'395260'
The "[2]" refers to the population, which is actually the third item in the line, since computers start counting at 0.
The line is then placed temporarily inside another variable called dupes. On the next repetition of the program, that line is compared to the subsequent line. If the Communal Section names of each match, then a duplicate has been found. In that case, the populations of each line are compared and the line with the larger population is appended to yet anther variable called "new_doc. The other is discarded. Once the program has finished looping through all the lines in the original document, "new_doc" is saved to a file with the same data minus the duplicates.
I then imported the new data into a spreadsheet as a csv (comma seperated values). Using some pretty standard spreadsheet functions, I was able to count the number of occurrences of the word "rural" and "urbain" to find the ratio of rural to urban Communal Sections in Haiti. And after all that, I could put this line into my report:
Ta da! Yes, it still sounds vague and imprecise, but that's because it is one small observation in a larger story. Also, it is for radio, where it is difficult to convey complicated data. The point is, I now know it is backed by solid facts and not just a summary of anecdotes.
Data
For anyone interested in the data, here it is: